
Table of Contents
This interface is used to analyse the data collected on Muon instruments in the frequency domain. The interface can be accessed from the main menu of MantidPlot, in Interfaces → Muon → Frequency Domain Analysis. For sample datasets, please visit Muon - Downloads.
This interface is currently still in development. The data needs to be loaded and prepared using Muon Analysis (old). When Frequency Domain Analysis is opened it will import the groups/pairs from the current run in Muon Analysis, if no data has been loaded into Muon Analysis then Frequency Domain Analysis will not open.
Analysis of the frequency spectrum can be achieved by clicking the fit function icon. As the interfaces is developed the features from Muon Analysis will be replicated.
This tab is designed for the user to transform pre-loaded data into the frequency domain. At present there are two methods available, which the user can switch between by using the drop-down menu at the top of the interface.
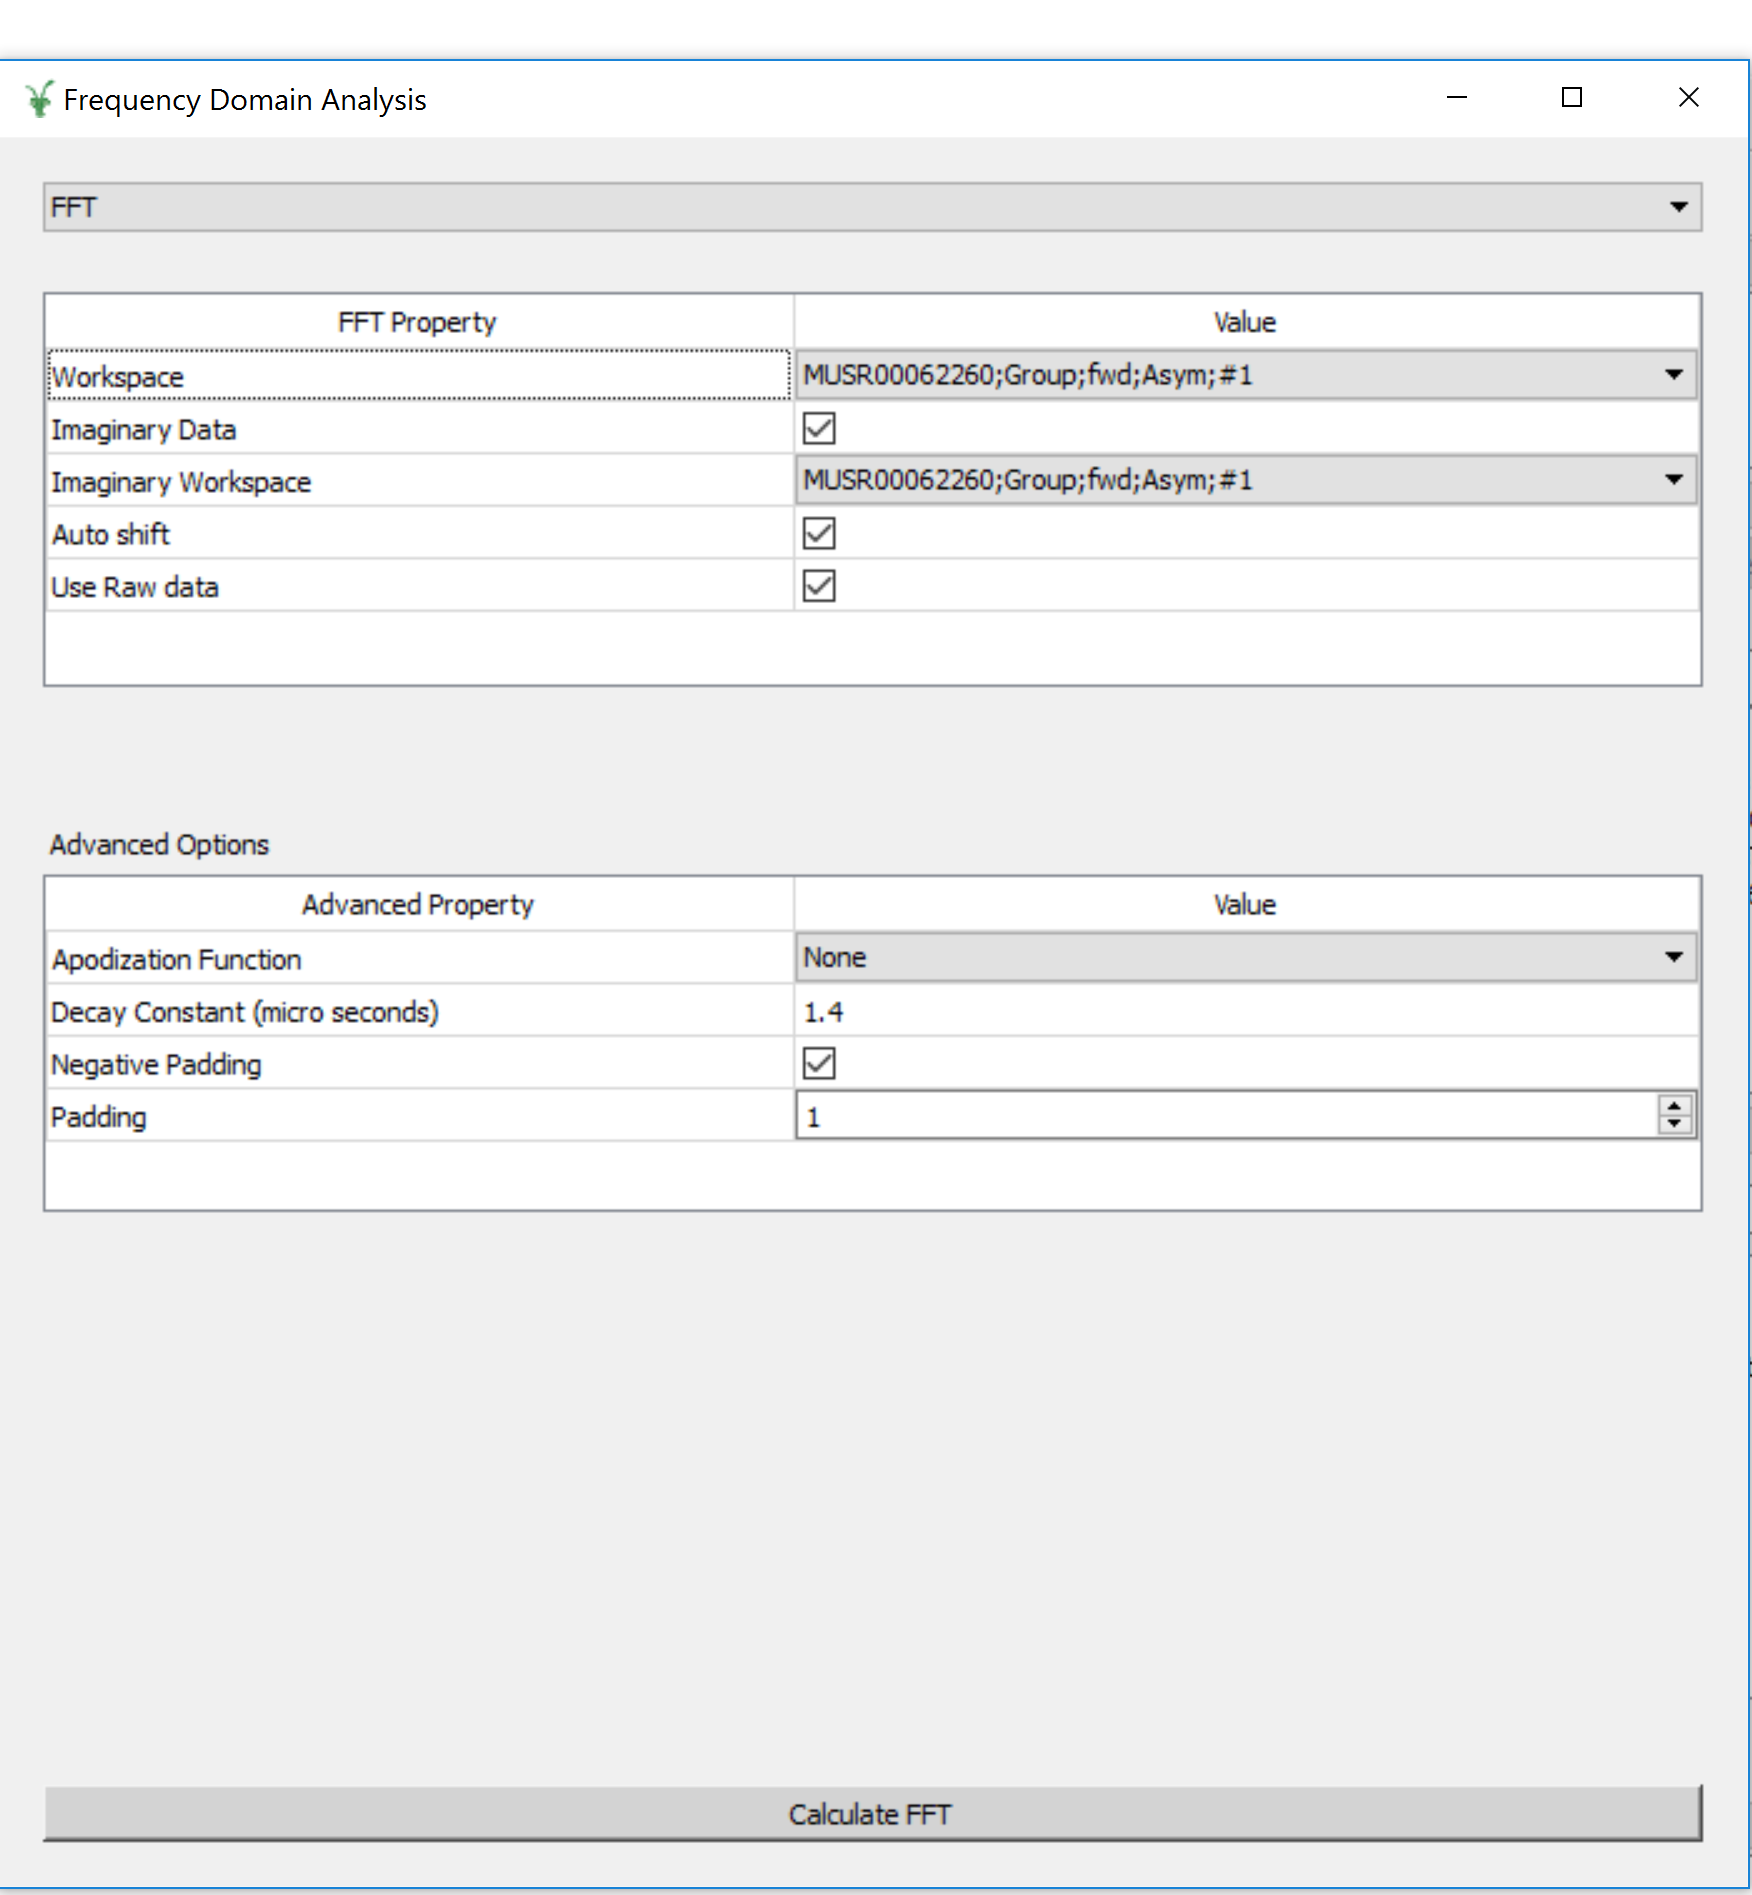
In this mode the interface displays two tables, FFT and Advanced options. The FFT table contains all of the information required to produce a forward FFT. The Advanced Options table contains the information for adding padding and apodization functions to the data.
Selecting the workspace to be PhaseQuad will cause the PhaseQuad algorithm to be called first. If no phase table is available then
the interface will generate one and output the result as PhaseTable. It is possible to select the direction of the axis when generating the table and it is
possible to use a pre-existing PhaseTable. Note that the PhaseQuad option requires the data archieve to be in the search directory.
The Calculate button will execute the Padding and Apodization and then FFT algortihms. The output workspace will be added to appropriate grouped workspace.
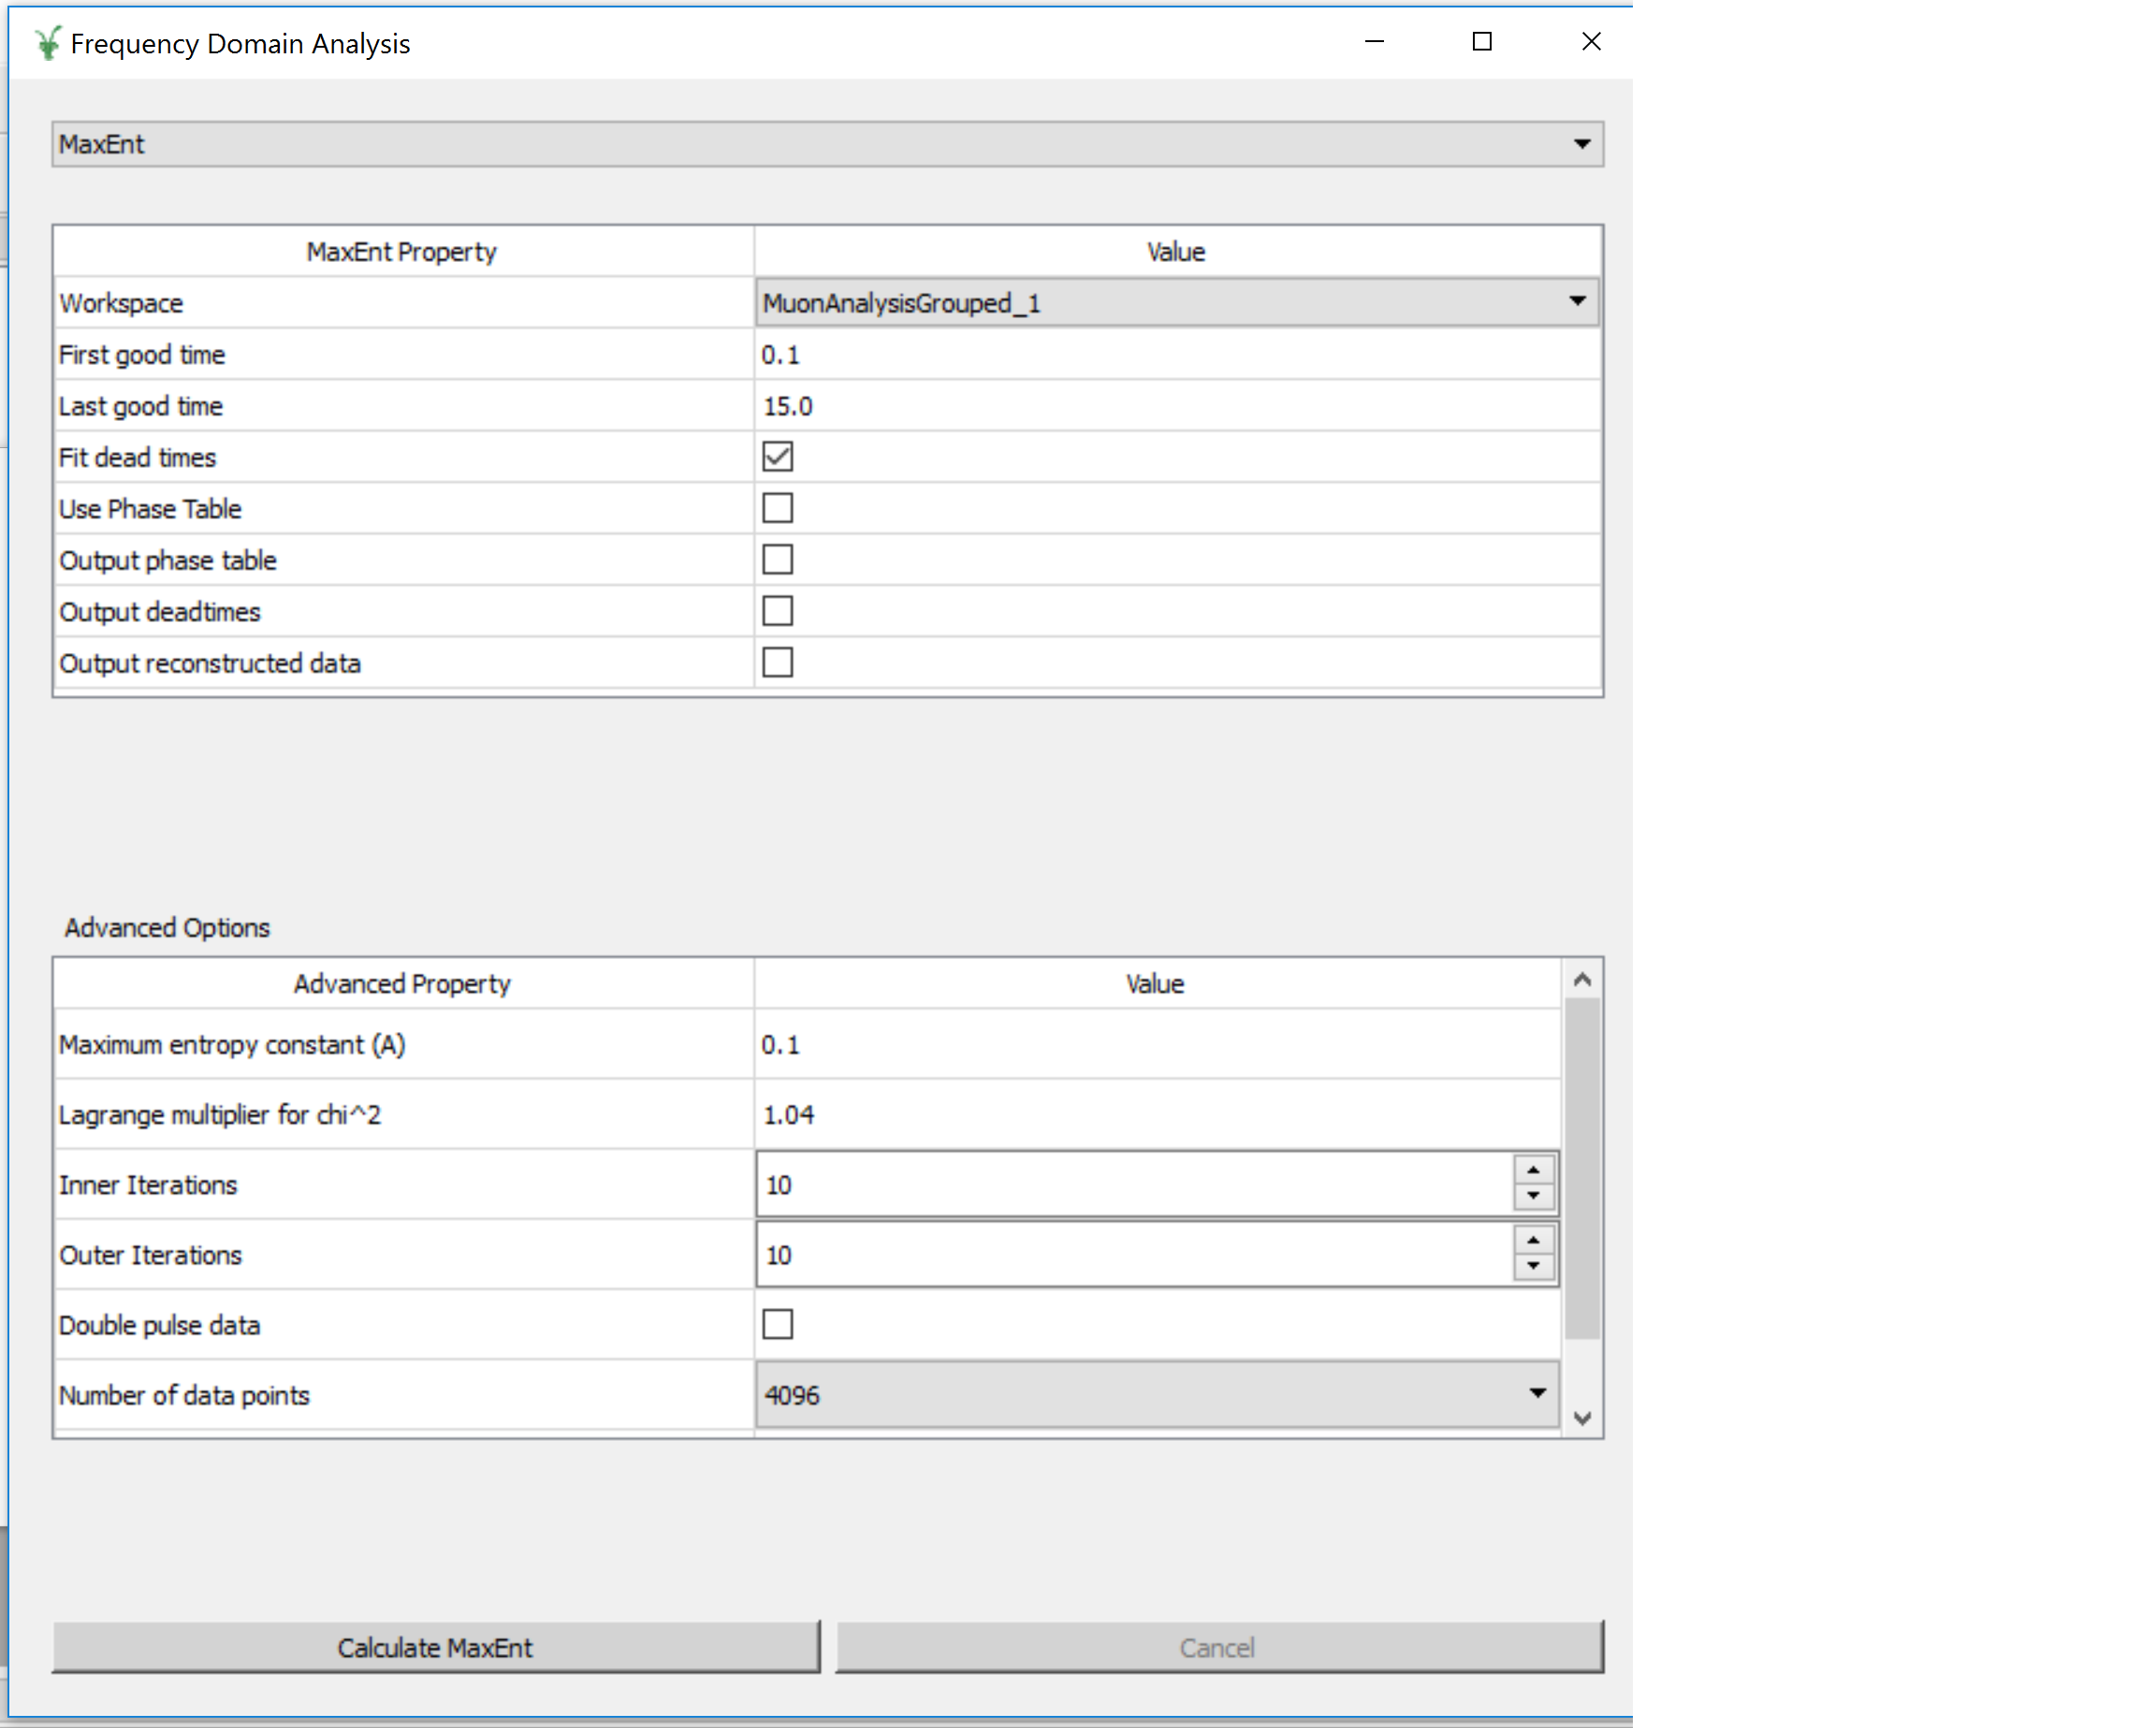
The maximum entropy method can be used to calculate the frequency domain spectrum. This interface uses the MuonMaxent algorithm to calculate the frequency spectrum. The MaxEnt Property table contains
the basic quantitites used during the calculation. If the Use Phase Table checkbox is set to true, then an input phase table will be used for the initial phase values (the phase table will be called PhaseTable). To generate
an estimate phase table the Construct Phase Table option can be used and when the Calculate MaxEnt button is pressed CalMuonDetectorPhases is ran first to generate the phase table. If the
Construct Phase Table option is not selected then PhaseTable must already exist. At present Construct Phase Table does not work with the MuonAnalysisGrouped workspaces. If the Workspace is set to the run number then
their is no pre-defined grouping.
The
Advanced property table contains variables for users that would
like more control overt the calculation.
For large calculations this interface can be slow, therefore the Calculate button is disabled until the current calculation is complete.
If you have any questions or comments about this interface or this help page, please contact the Mantid team or the Muon group.
Categories: Interfaces | Muon